Coupled mode theory#
Caution
This example is under construction, results are not yet all correct
https://www.fiberoptics4sale.com/blogs/wave-optics/coupled-mode-theory https://www.fiberoptics4sale.com/blogs/wave-optics/two-mode-coupling
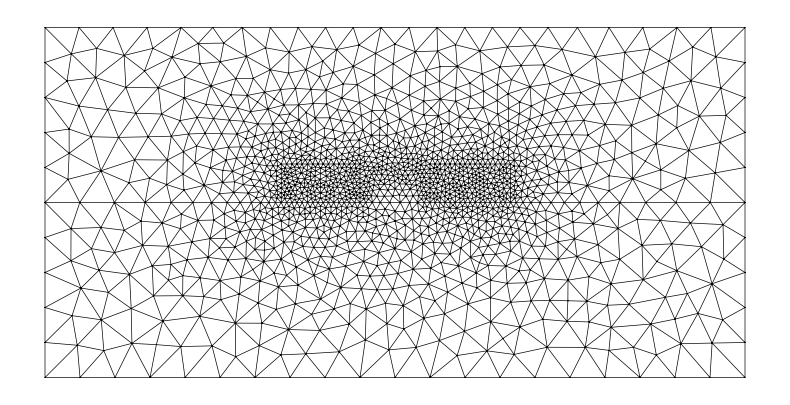
Let’s set up the geometry! It’s the cross-section of two parallel waveguides with different widths:
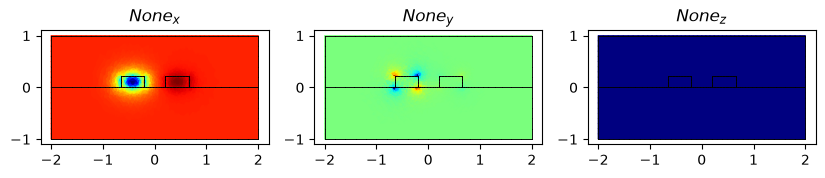
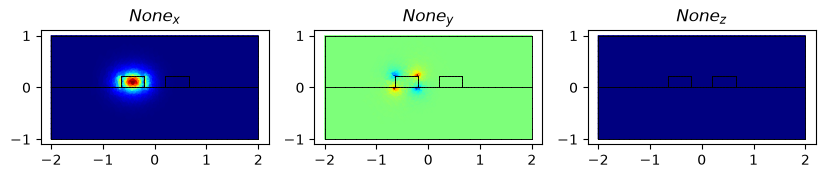
First we plot the symmetric and the asymmetric modes of the geometry with both waveguides:
basis0 = Basis(mesh, ElementTriP0(), intorder=4)

epsilon = basis0.zeros() + 1.444**2
epsilon[basis0.get_dofs(elements=("core_1", "core_2"))] = 3.4777**2
# basis0.plot(epsilon, colorbar=True).show()
modes_both = compute_modes(basis0, epsilon, wavelength=wavelength, mu_r=1, num_modes=2)
modes_both[0].show(modes_both[0].E.real, direction="x")
modes_both[1].show(modes_both[1].E.real, direction="x")
print(
    "Refractive index of symmetric and assymetric mode:",
    modes_both[0].n_eff,
    ", ",
    modes_both[1].n_eff,
)
# https://www.fiberoptics4sale.com/blogs/wave-optics/directional-couplers
print(
    f"Maximum power transfer after {np.pi / (2 * np.pi / wavelength * np.real(modes_both[0].n_eff - modes_both[1].n_eff))} um prop length"
)
/tmp/ipykernel_10314/3693127342.py:7: DeprecationWarning: The behavior of passing an array directly to `show` is deprecated and will be removed in the future. Use `plot` instead.
  modes_both[0].show(modes_both[0].E.real, direction="x")
/tmp/ipykernel_10314/3693127342.py:8: DeprecationWarning: The behavior of passing an array directly to `show` is deprecated and will be removed in the future. Use `plot` instead.
  modes_both[1].show(modes_both[1].E.real, direction="x")
Refractive index of symmetric and assymetric mode: (2.3491703331232974+0j) ,  (2.371121371079283+0j)
Maximum power transfer after -35.30584756647811 um prop length
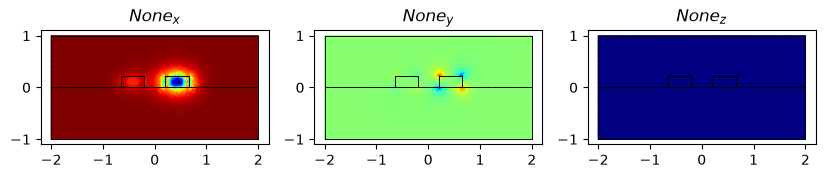
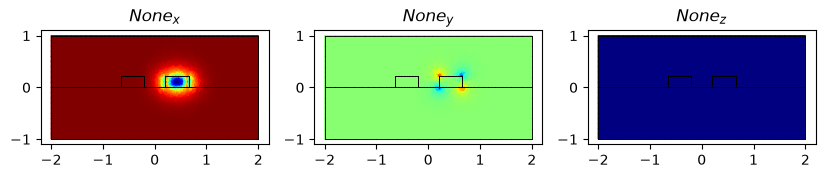
And then we plot the modes of each waveguide while setting the shape of the other one to oxide
epsilon = basis0.zeros() + 1.444**2
epsilon[basis0.get_dofs(elements="core_1")] = 3.4777**2
# basis0.plot(epsilon, colorbar=True).show()
modes_1 = compute_modes(basis0, epsilon, wavelength=wavelength, mu_r=1, num_modes=1)
print("Effective refractive index of the mode of the first waveguide", modes_1[0].n_eff)
modes_1[0].show(modes_1[0].E.real, direction="x")

epsilon_2 = basis0.zeros() + 1.444**2
epsilon_2[basis0.get_dofs(elements="core_2")] = 3.4777**2
# basis0.plot(epsilon_2, colorbar=True).show()
modes_2 = compute_modes(basis0, epsilon_2, wavelength=wavelength, mu_r=1, num_modes=1)
print("Effective refractive index of the mode of the second waveguide", modes_2[0].n_eff)
modes_2[0].show(modes_2[0].E.real, direction="x")
Effective refractive index of the mode of the first waveguide (2.349540399191193+0j)
/tmp/ipykernel_10314/185950769.py:6: DeprecationWarning: The behavior of passing an array directly to `show` is deprecated and will be removed in the future. Use `plot` instead.
  modes_1[0].show(modes_1[0].E.real, direction="x")
Effective refractive index of the mode of the second waveguide (2.370660339027539+0j)
/tmp/ipykernel_10314/185950769.py:13: DeprecationWarning: The behavior of passing an array directly to `show` is deprecated and will be removed in the future. Use `plot` instead.
  modes_2[0].show(modes_2[0].E.real, direction="x")
length = 200
ts = np.linspace(0, length, 1000)
epsilons = [epsilon, epsilon_2]
num_modes = len(modes_1) + len(modes_2)
overlap_integrals = np.zeros((num_modes, num_modes), dtype=complex)
for i, mode_i in enumerate(chain(modes_1, modes_2)):
for j, mode_j in enumerate(chain(modes_1, modes_2)):
overlap_integrals[i, j] = mode_i.calculate_overlap(mode_j)
print("overlap", overlap_integrals)
# plt.imshow(np.abs(overlap_integrals))
# plt.colorbar()
# plt.show()
coupling_coefficients = np.zeros((num_modes, num_modes), dtype=complex)
for i, mode_i in enumerate(chain(modes_1, modes_2)):
for j, mode_j in enumerate(chain(modes_1, modes_2)):
coupling_coefficients[i, j] = (
k0
* speed_of_light
* epsilon_0
* mode_i.calculate_coupling_coefficient(
mode_j, epsilons[(j // len(modes_1) + 1) % 2] - 1.444**2
)
* 0.5
)
print(coupling_coefficients)
# plt.imshow(np.abs(coupling_coefficients))
# plt.colorbar()
# plt.show()
kappas = np.array(
[
[
(
coupling_coefficients[i, j]
- overlap_integrals[i, (i + 1) % 2]
* coupling_coefficients[(i + 1) % 2, j]
/ overlap_integrals[(i + 1) % 2, (i + 1) % 2]
)
/ (
1
- overlap_integrals[0, 1]
* overlap_integrals[1, 0]
/ (overlap_integrals[0, 0] * overlap_integrals[1, 1])
)
for i in range(2)
]
for j in range(2)
]
)
print(kappas)
delta = 0.5 * (
np.real(modes_1[0].n_eff) * k0 + kappas[1, 1] - (np.real(modes_2[0].n_eff) * k0 + kappas[0, 0])
)
print(delta, np.real(modes_1[0].n_eff) * k0, kappas[1, 1])
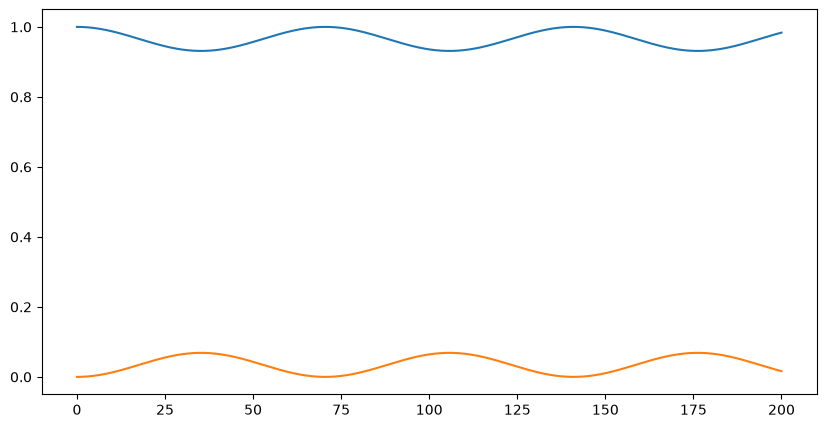
beta_c = (kappas[0, 1] * kappas[1, 0] + delta**2) ** 0.5
print(np.pi / (2 * beta_c))
eta = np.abs(kappas[1, 0] ** 2 / beta_c**2) * np.sin(beta_c * 1e3)
print("eta", eta, np.abs(kappas[1, 0] ** 2 / beta_c**2))
plt.plot(ts, 1 - np.abs(kappas[1, 0] ** 2 / beta_c**2 * np.sin(beta_c * ts) ** 2))
plt.plot(ts, np.abs(kappas[1, 0] ** 2 / beta_c**2 * np.sin(beta_c * ts) ** 2))
plt.show()
overlap [[ 1.        +0.j -0.01395496+0.j]
 [-0.01395496+0.j  1.        +0.j]]
[[ 0.00073614+0.j -0.011687  +0.j]
 [-0.01287565+0.j  0.00062816+0.j]]
[[ 0.00055657+0.j -0.01286788+0.j]
 [-0.01168051+0.j  0.00046516+0.j]]
(-0.04285231595178107+0j) 9.524256590208365 (0.00046515805938501255+0j)
(35.24211803142078+0j)
eta (0.03816703470993773+0j) 0.06867639765290072
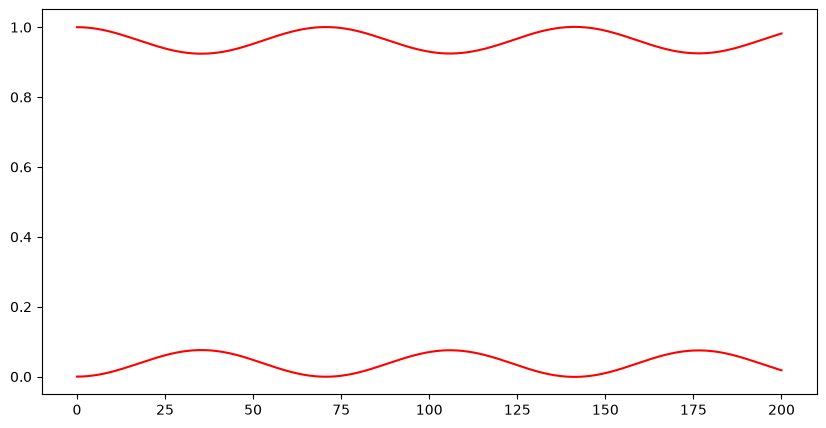
see http://home.iitj.ac.in/~k.r.hiremath/research/thesis.pdf , not yet finished
def fun(t, y):
    phase_matrix = [
        [
            np.exp(2j * np.pi / wavelength * (mode_i.n_eff - mode_j.n_eff) * t)
            for mode_j in chain(modes_1, modes_2)
        ]
        for mode_i in chain(modes_1, modes_2)
    ]
    matrix = (
        np.linalg.inv(overlap_integrals * phase_matrix)
        @ (coupling_coefficients * phase_matrix)
        * -1j
    )
    return (matrix @ y).ravel()


result = solve_ivp(fun, [0, length], np.array((1, 0), dtype=complex), t_eval=ts)
ys = result.y.T

plt.plot(ts, np.abs(np.array(ys)[:, 0]) ** 2, "r")
plt.plot(ts, 1 - np.abs(np.array(ys)[:, 0]) ** 2, "r")
# plt.plot(ts, np.array(ys).imag.reshape((-1,)+matrix.shape)@(1,0), 'g')
plt.show()
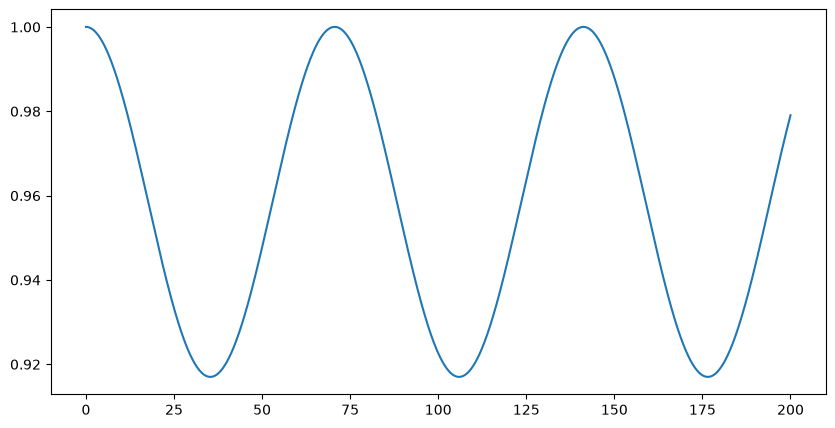
two modes#
R = [np.abs(modes_1[0].calculate_overlap(mode_j) ** 2) for mode_j in modes_both]
print(R)
P = (
    R[0] ** 2
    + R[1] ** 2
    + 2
    * R[0]
    * R[1]
    * np.cos(2 * np.pi / wavelength * (modes_both[0].n_eff - modes_both[1].n_eff) * ts)
)

plt.plot(ts, P)
plt.show()
[np.float64(0.9788107503909897), np.float64(0.0212031499099476)]
/home/runner/miniconda3/lib/python3.13/site-packages/matplotlib/cbook.py:1810: ComplexWarning: Casting complex values to real discards the imaginary part
  return math.isfinite(val)
/home/runner/miniconda3/lib/python3.13/site-packages/matplotlib/cbook.py:1407: ComplexWarning: Casting complex values to real discards the imaginary part
  return np.asanyarray(x, float)
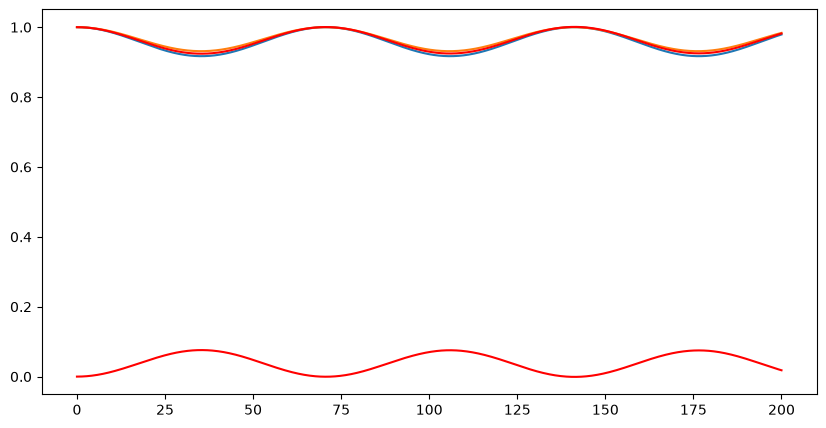
plt.plot(ts, P)


plt.plot(ts, 1 - np.abs(kappas[1, 0] ** 2 / beta_c**2) * np.sin(beta_c * ts) ** 2)

plt.plot(ts, np.abs(np.array(ys)[:, 0]) ** 2, "r")
plt.plot(ts, 1 - np.abs(np.array(ys)[:, 0]) ** 2, "r")
# plt.plot(ts, np.array(ys).imag.reshape((-1,)+matrix.shape)@(1,0), 'g')
plt.show()